Pre-Requisites
- Limits:A limit describes the behavior of a function as its input gets arbitrarily close to a specific value, but not necessarily reaching that value. (Input is y, y approaching a specific value for example zero so lim y->0
- Derivatives:Derivatives, also known as instantaneous rates of change, are calculated using limits. The derivative of a function at a point represents the slope of the tangent line to the function’s curve at that point.
- Relationship:The derivative is fundamentally defined using the concept of a limit. Specifically, the derivative is the limit of the difference quotient as the change in the input (often denoted as ‘h’) approaches zero.
I want you to imagine everything I say here. Picturize. Open your mind.
Lets Take 2 Examples –
Speed changing in a car – Differentiation (Rate of Change)
Filling a Swimming Pool, your bottle etc – Integration (Accumulation of water drop by drop IMAGINE IT!)
This blog will help you imagine calculus before solving it—so you always understand what you’re doing and why.
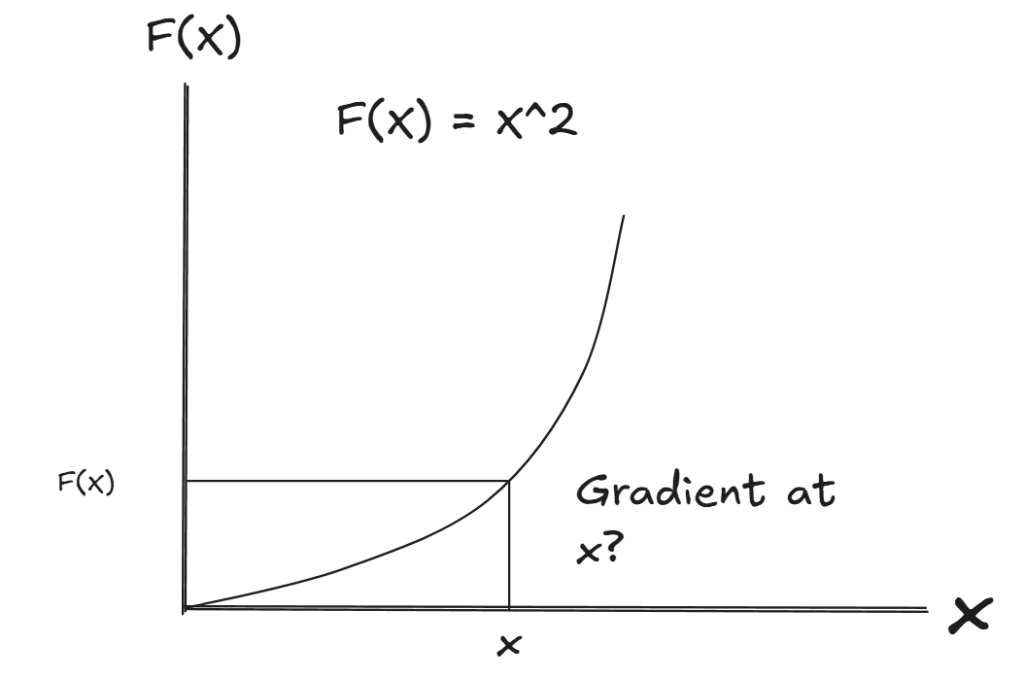
Let us plot a graph –
f(x) = x2
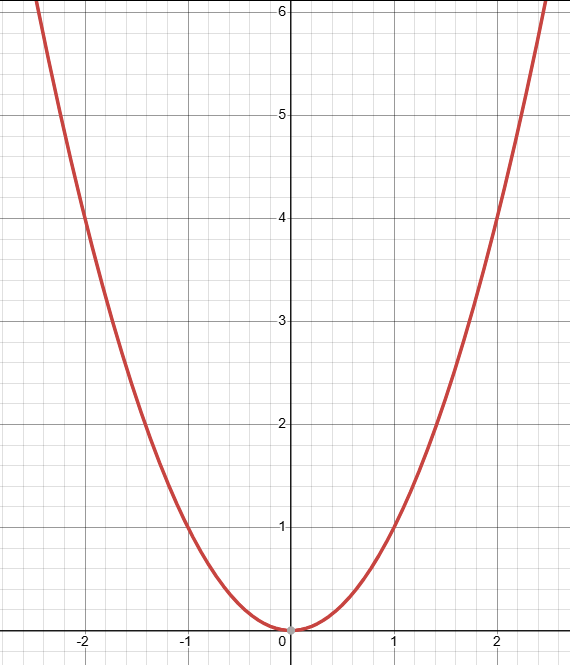
You can see in graph how values are changing. (1, 1), (2, 4) etc it goes on.
Differential Calculus
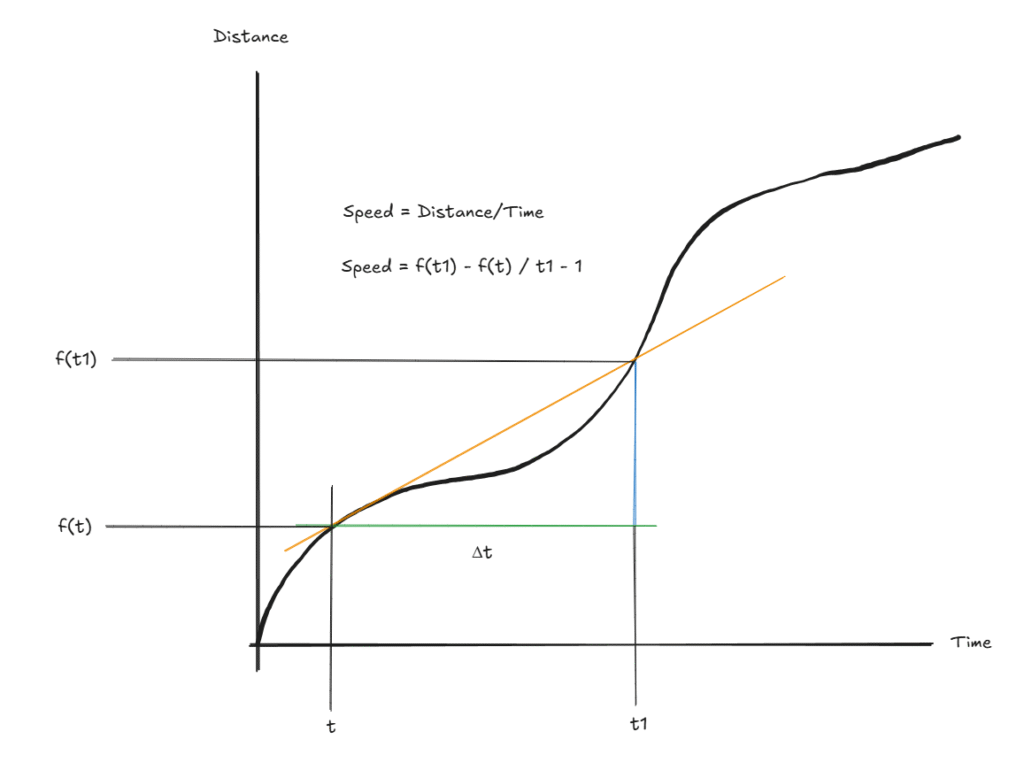
Now suppose you are driving on a road. The speed increases on clear road, it reduces on speed breakers and traffic.
This graph is you driving (Imagine It!)
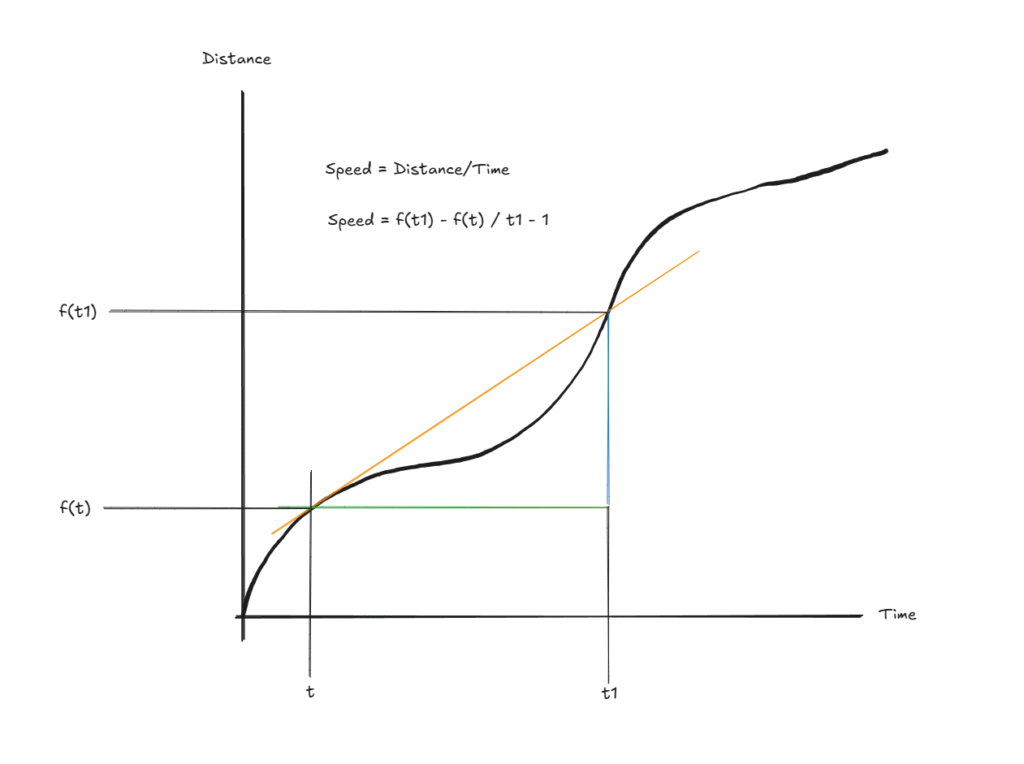
You know Speed = Distance / Time,
Orange line is speed. Green is time. Blue is distance.
I suggest you to pick up a pen and paper and do the derivations with me.
Speed = f(t1) – f(t) / t1 – t
Assume, t1 – t = Δt
Now, Speed = f(t + Δt) – f(t) / Δt
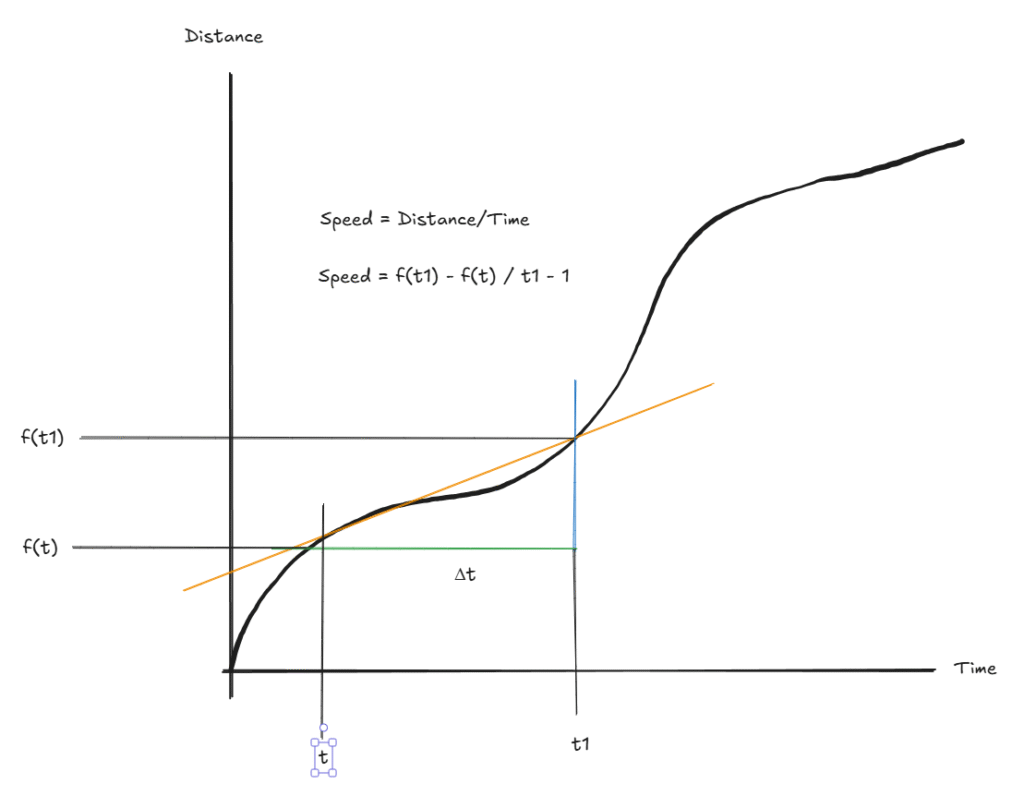
Now let us reduce Δt –
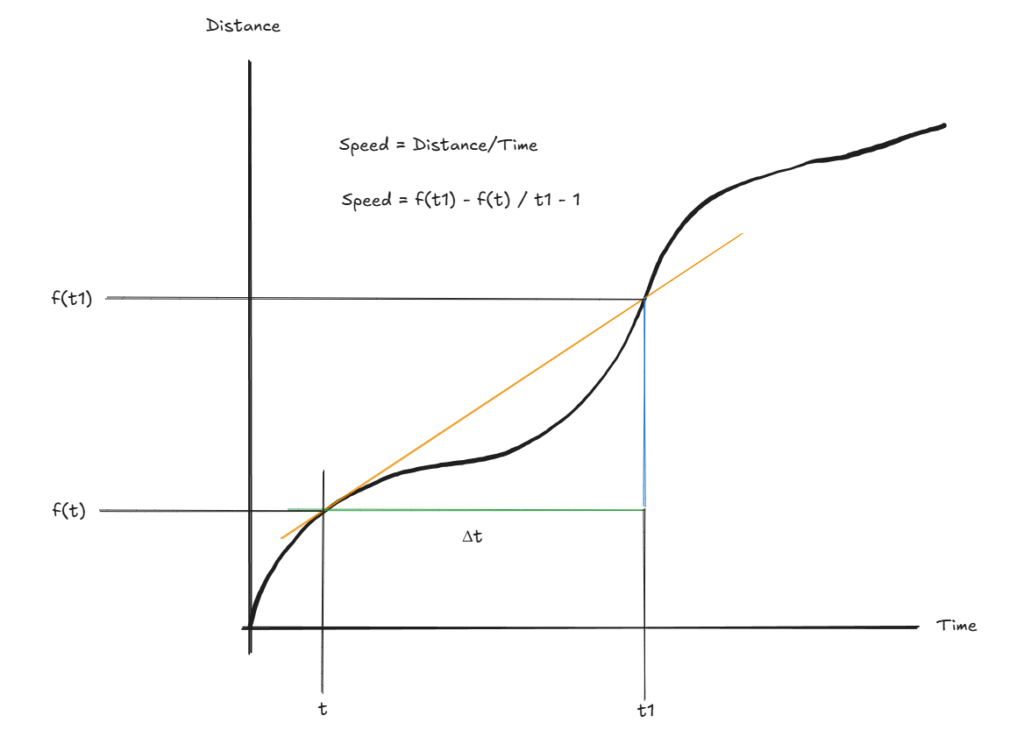
In this delta t covers a larger portion of your travel and the secant (orange line) is not accurately depicting the change of speed, right? So lets make it smaller.
Lets make it smaller gradually. Decrease it more.
Lets make it smaller and zoom in to see the result.
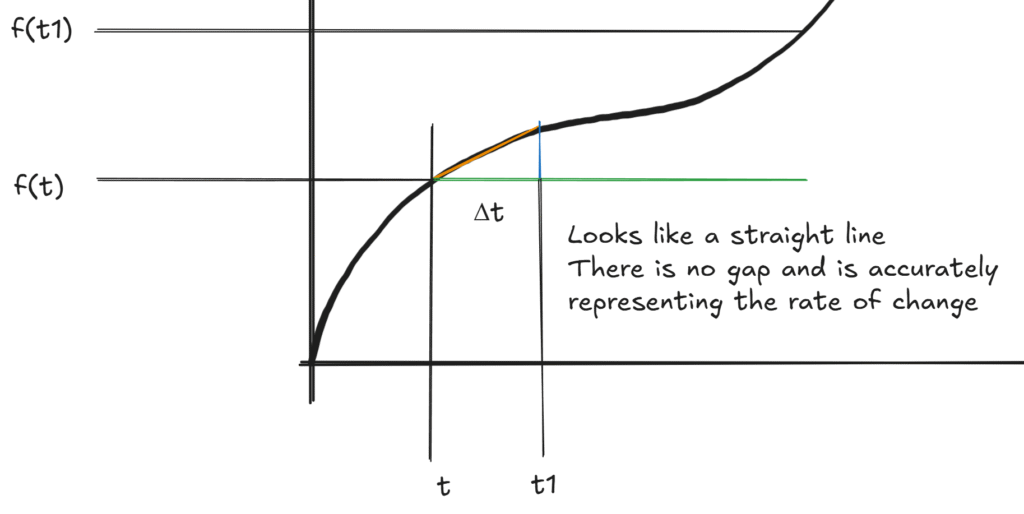
We can say that your car speed is represent more accurately when Δt approaches 0 (Δt becomes smaller and smaller).
We can say that Speed of car at t is
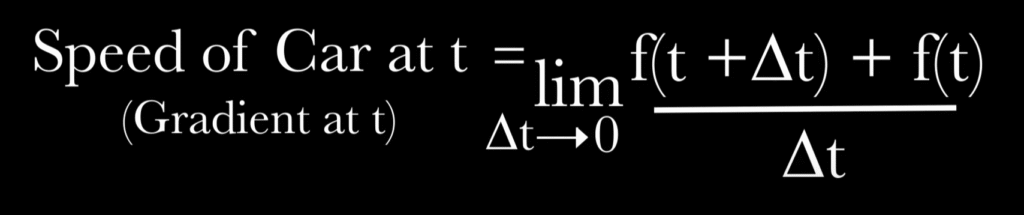
The above is final formula for car speed at t.
To make it clear, let us apply this to f(x) = x2
We have found the gradient at t with speed of car example, it applies here too so lets go ahead and do that.
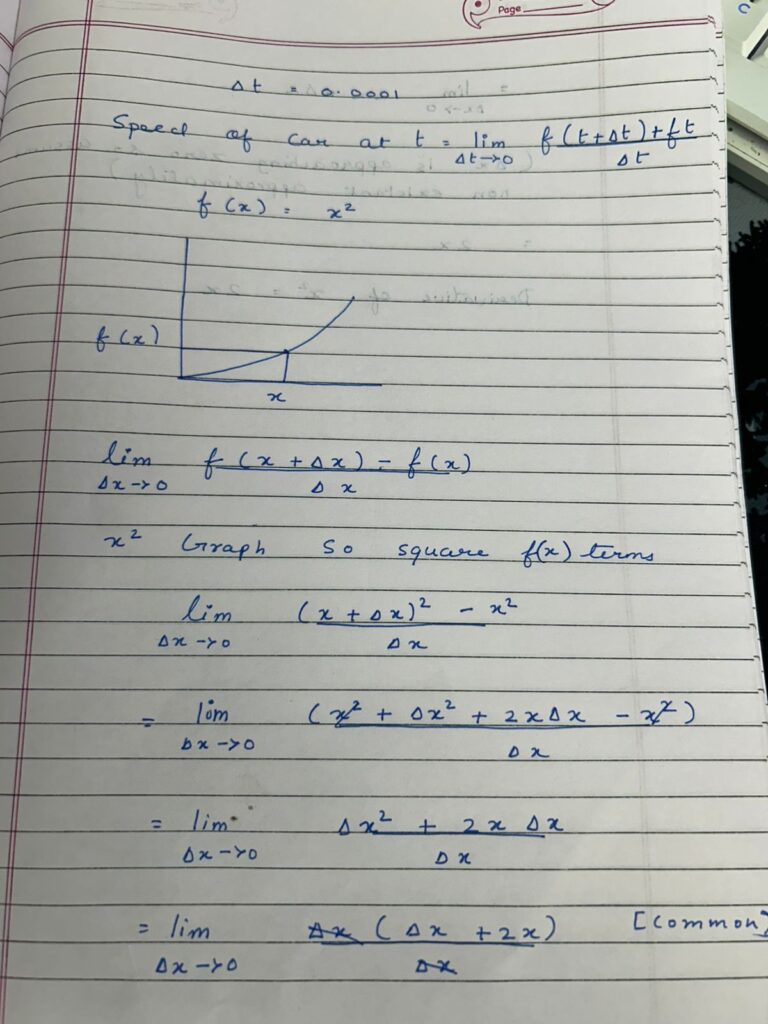
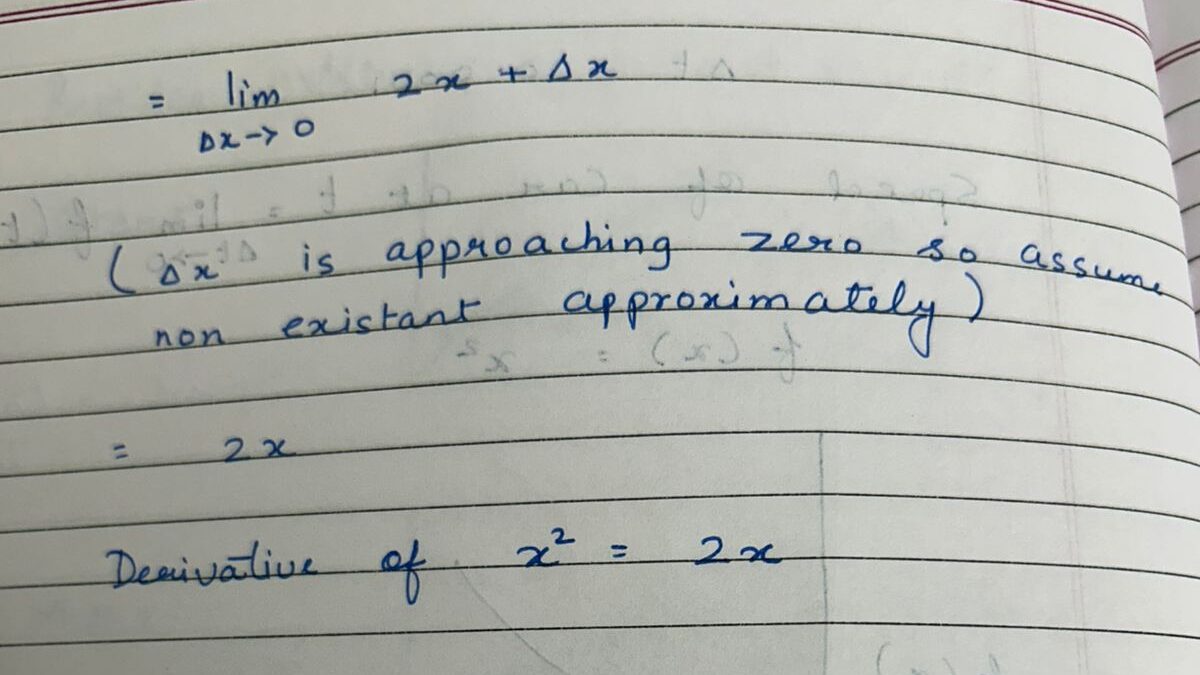
I have solved it above for you guys. You can go through it and do it yourself too.
We performed the derivative.
Go through it again and maybe do one yourself.
This is just the basic and there is so much more to this.
You can stay connected and I will write more explaining the base of things and how you can visualize and understand some things better.
Until next time ^^
Comments